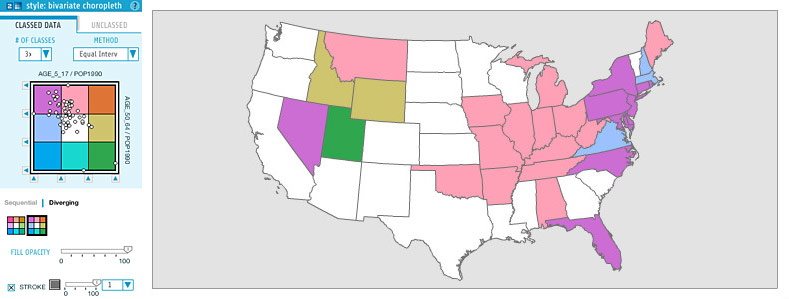
A bivariate choropleth map show two different data amounts at the same time. The map provided shows age populations within the United States at the start of the twentieth century. The key provided by the map gives two different sets of data (ages 5-17 and ages 50-64). The different types of data are distinguishable by colors. By using two different sets of data, this map can be considered a bivariate choropleth map.
No comments:
Post a Comment