http://www.lib.utexas.edu/maps/italy.html
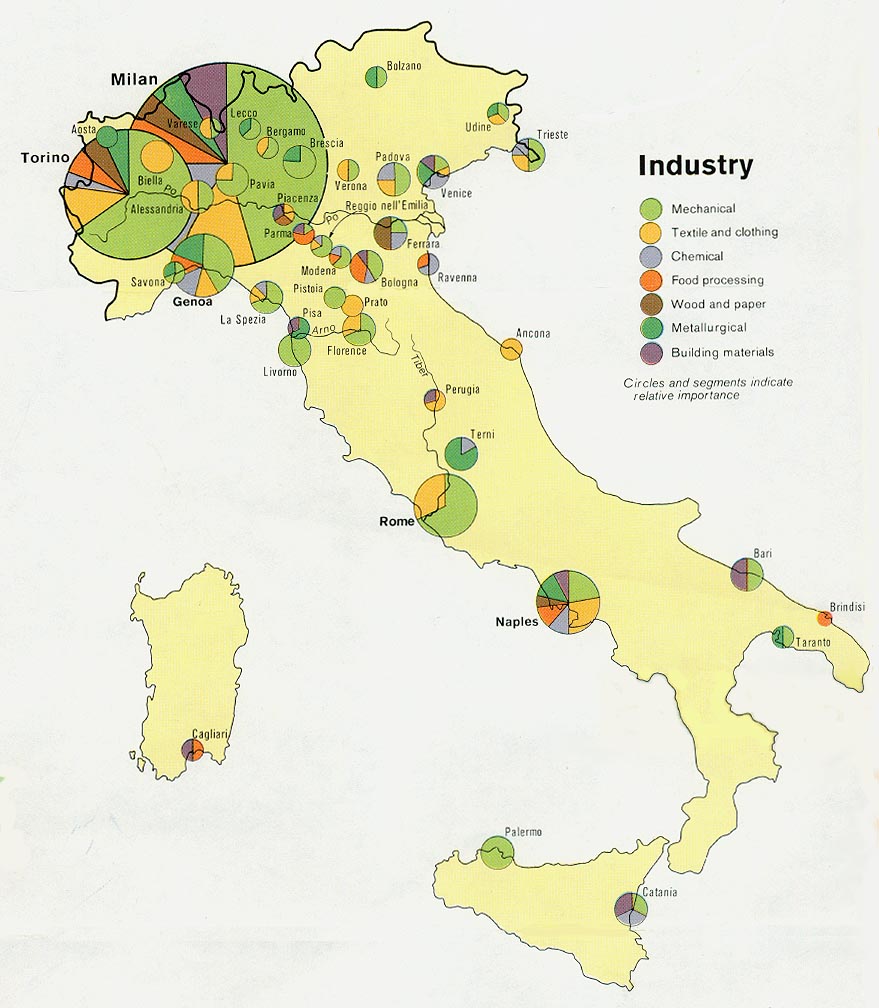
The longwinded name of the continuously variable proportional circle map is a map subject of the proportional circle map. However, this map displays a multitude of variables to show exactly how the different circles relate to each other through their proportions. These maps are useful because they can display relating scales to data specifically through their use of circles. In the map provided, the circles represent the different industries within Italian cities. These circles, just like a proportional map, use size to display how large an industry is, however they also divide these circles within themselves to show the different industries within each city. By displaying all this information through circles makes this map a continuously variable proportional circle map.
No comments:
Post a Comment